
Introduction
Managing logs today is a must-have in any web service. Logs can help us to debug and identify problems in any environment. This post delves into the practicality of handling Azure logs with custom dimensions in the Django Rest Framework. We’ll explore how this combination simplifies the debugging process, allowing for categorized filtering and enhanced capabilities through custom dimensions. To offer a clear and straightforward guide, we’ll navigate the landscape where Django Rest Framework meets Azure Logs, providing a practical approach to optimize your application’s logging strategies.
Server-Side Django Settings
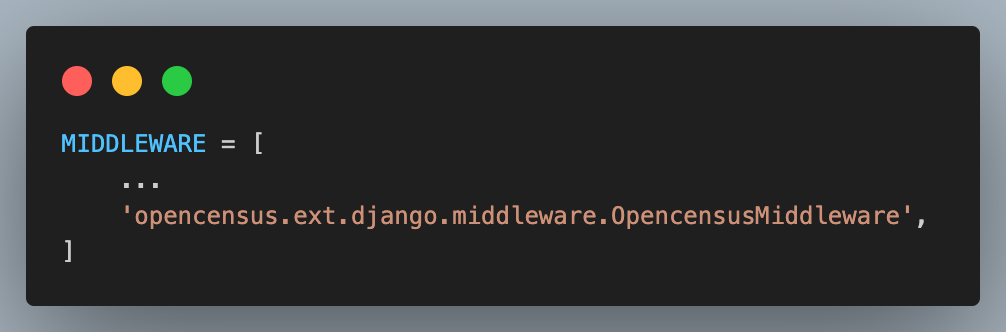
The OpenCensus Python SDK serves as the tool we employ to manage Azure logs in Django. To seamlessly integrate this, adjustments are necessary within your settings.py file to align the LOGGING configuration with server-side deployment. Our initial step involves the incorporation of the Microsoft Azure middleware:
Next, we proceed to incorporate the unique configuration labeled OPENCENSUS specifically designed for Azure Traces:
Replace “YOUR_CONNECTION_STRING” with your Azure connection key. To conclude, ensure that your LOGGING configuration includes the definition and assignment of AzureLogHandler to loggers:
Local Django Settings
To examine the display of Azure logs from the local side and understand their presentation on the server side, a simple adjustment in the LOGGER setting is all that is required:
A crucial modification involves updating the root key, accompanied by an adjustment in the Django logger (observe the alteration in the level: “WARNING”). This adaptation addresses a local issue where the Django logger initializes before the occurrence of Azure logs. Failing to configure it in this manner may result in the server being unresponsive or not generating any errors, despite the service seeming operational.
Azure Traces
After configuring the Django settings file as detailed earlier, every log originating from the Python Standard Logging Library will be automatically transmitted as an Azure Trace, contingent upon the specific route accessed. For instance, let’s see this route:
The related view would be:
Upon initiating the local server, we have the option to access the endpoint using cURL and observe its output:
Django console will respond with this output:
Navigate to Azure, then proceed to Application Insights, followed by my-server-name, and finally Logs. Here, you can conduct a search for your log using the Kusto Query Language (KQL):
Our logs will be visible on the Azure Analytics page as they come through. A variety of queries can be employed to retrieve logs.
Azure Custom Dimensions
To include custom properties in our log messages, utilize the extra keyword argument of the Python logger, incorporating the special custom_dimensions key. These properties will be presented as key-value pairs within the customDimensions sub-section of the Log in Azure Monitor. For instance, in our earlier view, we can modify it to transmit Custom Dimensions as follows:
Upon saving these adjustments and re-sending the previous request, you will now observe the presentation of our custom property in the customDimensions sub-section.